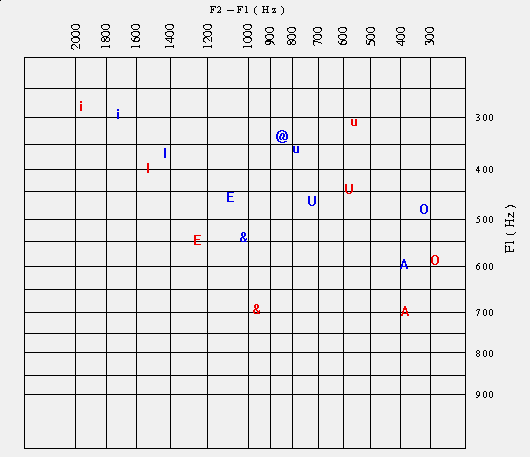
The symbols on the chart are as defined in Evan Kirshenbaum's
ASCII IPA.
Symbols in blue represent sounds spoken by Bob Cunningham. They are
selected from the twelve vowels whose formants are plotted at
"Twelve vowels".
Symbols in red represent values taken from a chart in Kirsten Malmkjaer's
The Linguistics Encyclopedia, page 7, in a paper written by Chin-W. Kim,
where they are attributed to "Ladefoged, 1982, page 279".
Kirsten Malmkjaer's The Linguistics Encyclopedia is ISBN 0-415-02942-2 (hbk),
0-415-122566-9 (pbk). Selection and editorial matter copyright
Kirsten Malmkjaer. Individual entries copyright the authors.
I've constructed the grid from measurements of Figure 10, page 7, in The Linguistics
Encyclopedia. The scales are not linear and they're not exactly
logarithmic. If anyone can tell me what mathematical relationship
they represent, I would greatly appreciate it. Ladefoged probably
explains the scales in his 1982 book, which I don't have.
"Ladefoged 1982" is "Ladefoged, P. (1982), A Course in Phonetics, 2nd edn,
New York, Harcourt Brace Jovanovich".
I've used Windows 3.1 Paintbrush to place the values on the chart. I'm
not fully satisfied with the accuracy of placement I've been able to achieve by this means,
but I feel that the locations are close enough to satisfy the intended purpose of the
chart.